Major League Baseball officially flipped its calendar from April to May this past weekend, which means we’ve arrived at a juncture of the season—roughly 15 percent through 2015’s total plate appearances, if you want to get overly specific—where player performance, trends and adjustments can be dissected with a certain amount of legitimacy and conviction.
So with that in mind, why not pose the question that seems to be increasing in its importance: who’s commanding the baseball most efficiently? Walk rates in April jumped to 8.3 percent league-wide for starting pitchers, a healthy buoy from 7.1 percent last season, and, notably, the highest single-season mark for rotation arms since the turn of the millennium. Indeed, the season remains relatively young, but that increase might serve to explain why offensive production has witnessed an early rebound.
Of course, there are better ways to evaluate command than simply a passing glance at walk rates. One example? Hitting the catcher’s target. Video scouts at Baseball Info Solutions (BIS) track the location of each pitch relative to catcher setup in (or out of) the strike zone, after which the analysts in BIS’s Research and Development department compile and formulate the data into easy-to-understand metrics with which to evaluate command.
BIS categorizes all pitches thrown into four categories of precision: A.) Pitches “closest” to the mitt, B.) “close” to the mitt, C.) “far” from the mitt, and D.) “farthest” from the mitt. Generally speaking, the league-average pitcher will throw roughly 25 percent of his total pitches within each category. In other words, pitchers will hit the target with precision about as often as they miss badly, and vice versa.
So without further ado, here are the top five and bottom five command leaders from April 2016 based on our “closest” to the mitt category. (All starting pitchers who qualified for the ERA title last month—100 in total, as luck would have it—were included in this sample.)
| Best “Mitt Rates”, April 2016 | |
|---|---|
| Pitcher | Hit Mitt % |
| Kyle Hendricks | 35% |
| Aaron Nola | 32% |
| Mike Pelfrey | 31% |
| Noah Syndergaard | 30% |
| Alex Wood | 30% |
| Chase Anderson | 29% |
| Zack Greinke | 29% |
| Mike Leake | 29% |
| Worst “Mitt Rates”, April 2016 | |
|---|---|
| Pitcher | Hit Mitt % |
| Rich Hill | 9% |
| Danny Salazar | 10% |
| Steven Wright | 11% |
| R.A. Dickey | 12% |
| Taijuan Walker | 12% |
| A.J. Griffin | 13% |
| Max Scherzer | 13% |
| Edison Volquez | 13% |
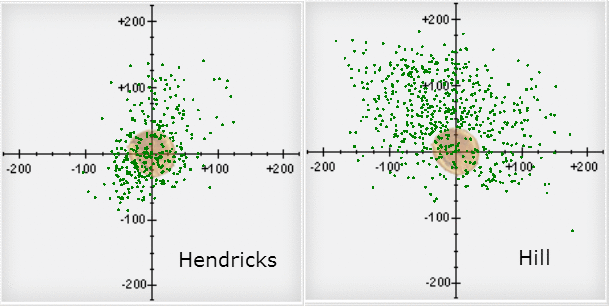
Kyle Hendricks is far from a stranger to employing exceptional command. In fact, no right-handed starter who qualified for the ERA title last season located a higher percentage (36 percent) of his total pitches “closest” to the mitt. Neither is Aaron Nola, for that matter. At just 21 years young in 2015, Philadelphia’s budding ace pounded the leather at a 30 percent frequency. That number is up a healthy 2 percent this season, perhaps due in large part to his April 11 start against San Diego, during which he located an absurd 51 percent of his offerings “closest” to the glove.
Max Scherzer isn’t used to being at or near the bottom of this list, but he is this season, having placed just 13 percent of his pitches closest to the catcher’s setup thus far (which could explain why his walk rate has more than doubled last year’s total). The same goes for Oakland’s Rich Hill, who found himself at the cellar of April’s Mitt-Rate leaderboard, with only 9 percent of his pitches closest to the glove, down from 15 percent last season and perhaps partially to blame for his surging walk rate to open up the 2016 campaign.
Along with supplying the raw data to evaluate command, BIS also has visually means to represent and compare command over specific spans. So, how do Hendricks and Hill—pitchers with the best and worst command, respectively, during the month of April—compare visually? To wrap up our April 2016 report, here’s a look:


