BY MARK SIMON
Tony Kemp had a really, really rough go of it in 2023. Kemp, one of the veteran leaders of an Athletics team that lost 112 games, hit .209, slugged .304, and had a .607 OPS.
But it probably shouldn’t have been anywhere near that bad.
Last week, we explained how Luke Raley was 2023’s leading overachiever, posting an OPS 123 points higher than his expected OPS.
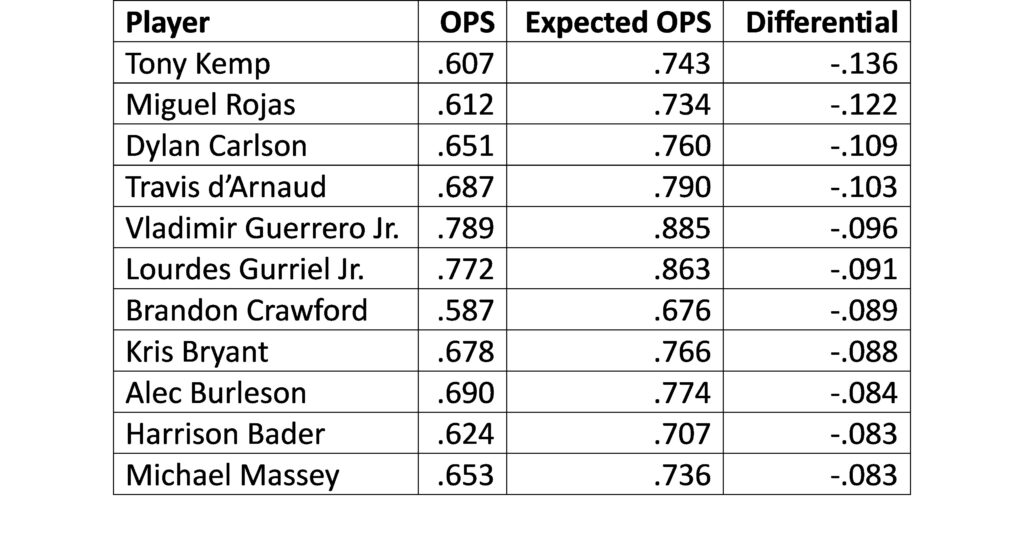
Kemp was 2023’s leading underachiever. His .607 OPS was 136 points lower than his .743 expected OPS
A brief point of explanation:
Sports Info Solutions tracks its own version of a player’s expected stats (similar to what you can find on Baseball Savant). Rather than basing a player’s hit probability (and subsequently single, double, triple, and home run probability) on a batted ball’s exit velocity and launch angle, SIS’ version estimates probabilities based on where balls are hit, how hard they are hit, and how long they spend in the air.
This allows us to compare a player’s actual stats to his expected stats.
Here’s the list of players with the largest negative differential between their 2023 OPS and their expected OPS. This stat is the other end of the list that we presented last week.
Biggest Negative Differential – 2023 OPS and Expected OPS
Minimum 250 Plate Appearances in 2023
 Kemp’s ledger consists of a fair number of instances in which he hit a line drive that hung up long enough (for example: here and here). There were also some nice defensive plays both on fly balls and ground balls (here and here), and a couple instances of balls that hit the pitcher and caromed right to a fielder (here and here).
There’s also an instance of losing a would-be hit to a force play (here). And, of course, he got bit by the abundance of foul territory in his home ballpark (though not often; only here).
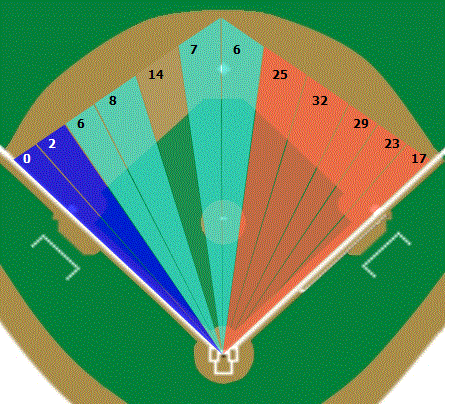
Here is what Kemp’s actual batting line looks like compared to his expected batting line.
 There is a huge difference between what Kemp was and what he could have been. By his performance, Kemp was one of the worst-performing hitters in baseball. By his expected performance, Kemp’s OPS would have been better than the average second baseman (.724) and almost a match for an average-hitting left fielder (.751).
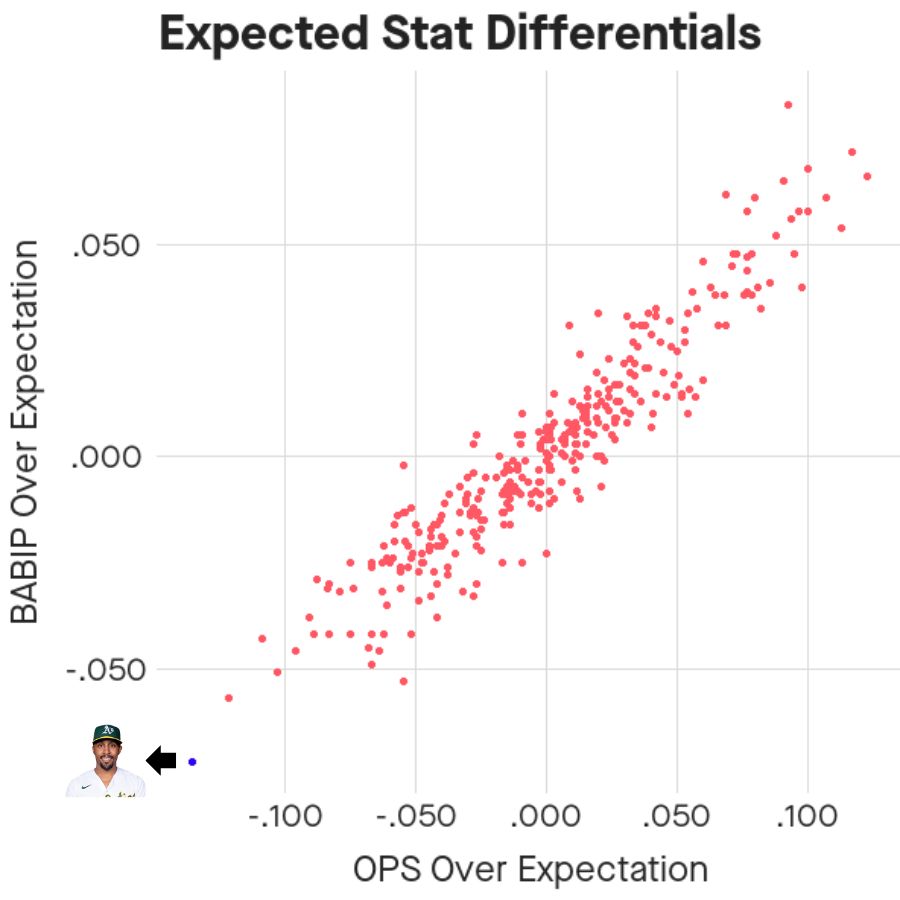
This graph shows the range of outcomes in expected BABIP differential and expected OPS differential. Kemp’s stats are outliers. They’re represented by the blue dot in the lower left of the graph.

One more example on how Kemp’s hit total was less than expected: If you take all the batted balls he hit with an expected hit rate of between 20% and 60%, Kemp was expected to net 42 hits. He totaled only 26, a 16-hit difference.
There are some prominent players among the others on the underachievers list. Among them is Vladimir Guerrero Jr. who hit .264 and slugged .444. His expected numbers would have made his season look a lot different. He tallied a .302 expected batting average and .507 expected slugging percentage.
Guerrero Jr.’s loss of hits on those 20% to 60% balls isn’t quite as extreme as Kemp’s but was still prominent. He was expected to net 72 hits on those batted balls. He totaled 62.
The usual disclaimer applies: We’re not necessarily saying that Kemp’s or Guerrero’s numbers will be better such as to make up for what happened in 2023 (though the Steamer projection on FanGraphs suggests a nice bounceback). We’re just pointing out that it would be difficult for an average player to put up Kemp’s line and Guerrero’s line, much like it would be tough to put up Raley’s overachieving line.


