Red Sox catcher Connor Wong played in the same number of games in 2024 as he did in 2023. But it was a much different season for him as a hitter.
| At-Bats | Hits | K | BA | OPS | |
| 2023 | 371 | 87 | 134 | .235 | .673 |
| 2024 | 447 | 125 | 114 | .280 | .758 |
Now rather than proclaim that Wong had some sort of breakthrough, we’re going to tell you something different. Wong was by our measures – the biggest overachiever of 2024.
A brief point of explanation:
Sports Info Solutions tracks its own version of a player’s expected stats (similar to what you can find on Baseball Savant). Rather than basing a player’s hit probability (and subsequently single, double, triple, and home run probability) on a batted ball’s exit velocity and launch angle, SIS’ version estimates probabilities based on where balls are hit, how hard they are hit, how long they spend in the air, and the speed of the batter. Ballpark is also taken into account.
This allows us to compare a player’s actual stats to his expected stats.
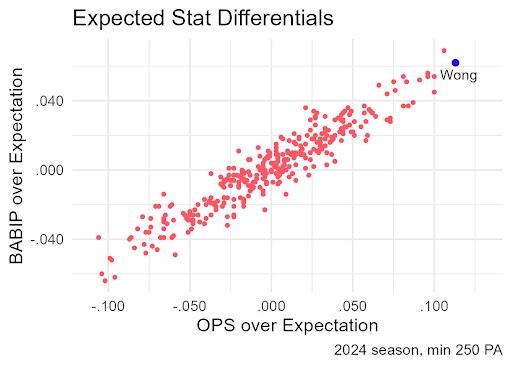
And when we compare Wong’s actual and expected stats, there are big differences. Wong had a .758 OPS and a .645 expected OPS. His OPS differential between his real and expected numbers was 113 points, the biggest difference for any player with at least 250 plate appearances in 2024.
Biggest Differential – 2024 OPS and Expected OPS
Minimum 250 Plate Appearances in 2024
| Player | OPS | Expected OPS | Differential |
| Connor Wong | .758 | .645 | .113 |
| Matt Wallner | .894 | .788 | .106 |
| Tyler O’Neill | .847 | .734 | .100 |
| Xavier Edwards | .820 | .720 | .100 |
| Jose Iglesias | .830 | .734 | .096 |
| Rob Refsnyder | .830 | .734 | .096 |
| Carlos Correa | .905 | .814 | .091 |
| Bryce Harper | .898 | .811 | .087 |
| Parker Meadows | .743 | .659 | .084 |
| Bobby Witt Jr. | .977 | .894 | .083 |
Your first instinct might be that playing in Fenway Park boosted Wong’s numbers. That’s a component, but there’s something else involved here.
Wong had 7 hits on batted balls with a hit probability of 10% or lower in 2024. He had none in 2023. All of those hits were on ground balls or bunts (examples include this and this). Wong had 48 ground ball or bunt base hits in 2024. By SIS’ expected numbers, he was projected to have 36.
Wong’s 10 hits on fly balls and line drives that had the lowest hit probability all came at home. Though ballpark is taken into account, “wall balls” at Fenway Park aren’t fully neutralized by our system (balls like this and this). From those 10 balls, Wong was expected to record only 1.7 hits. On all his other fly balls and line drives, his actual hits total and expected hits total were close to the same.
In sum, Wong had 12 more ground ball/bunt hits than expected and 8 more hits than expected on line drives and fly balls. He had the biggest difference in OPS above expected OPS and the second-biggest difference in BABIP versus expected BABIP.

Wong is one of three Red Sox to rank among the top 10 overachievers in OPS in 2024. The others were also right-handed hitters, Tyler O’Neill and Rob Refsnyder.
Luck is one reason that a hitter could outperform his expected numbers. Hustle can help too. Jose Iglesias of the Mets came up fifth on this leaderboard. His effort won him a few more hits than expected, such as this one against the Athletics and this one against the Diamondbacks.
In fact, as was noted on a Mets broadcast late in the season, Iglesias’ hustle on that latter play, in a game his team was losing 10-2 with two outs in the ninth inning on June 1 set an example for how the Mets needed to play the rest of the season. They had the best record in MLB from the next day to the end of the season.
Iglesias totaled 36 ground ball hits in 2024. He had an expected total of 27 based on how hard and where those balls were hit, accounting for much of his overachieving numbers.
We’ll look at the most underachieving hitters next week.


