This weekend the Eagles play the Commanders in the NFC Championship Game. One of the big questions is Jalen Hurts’ health, which primarily matters because in theory the Eagles should have an advantage through the air.
Here are a couple of compelling schematic splits to make the argument.
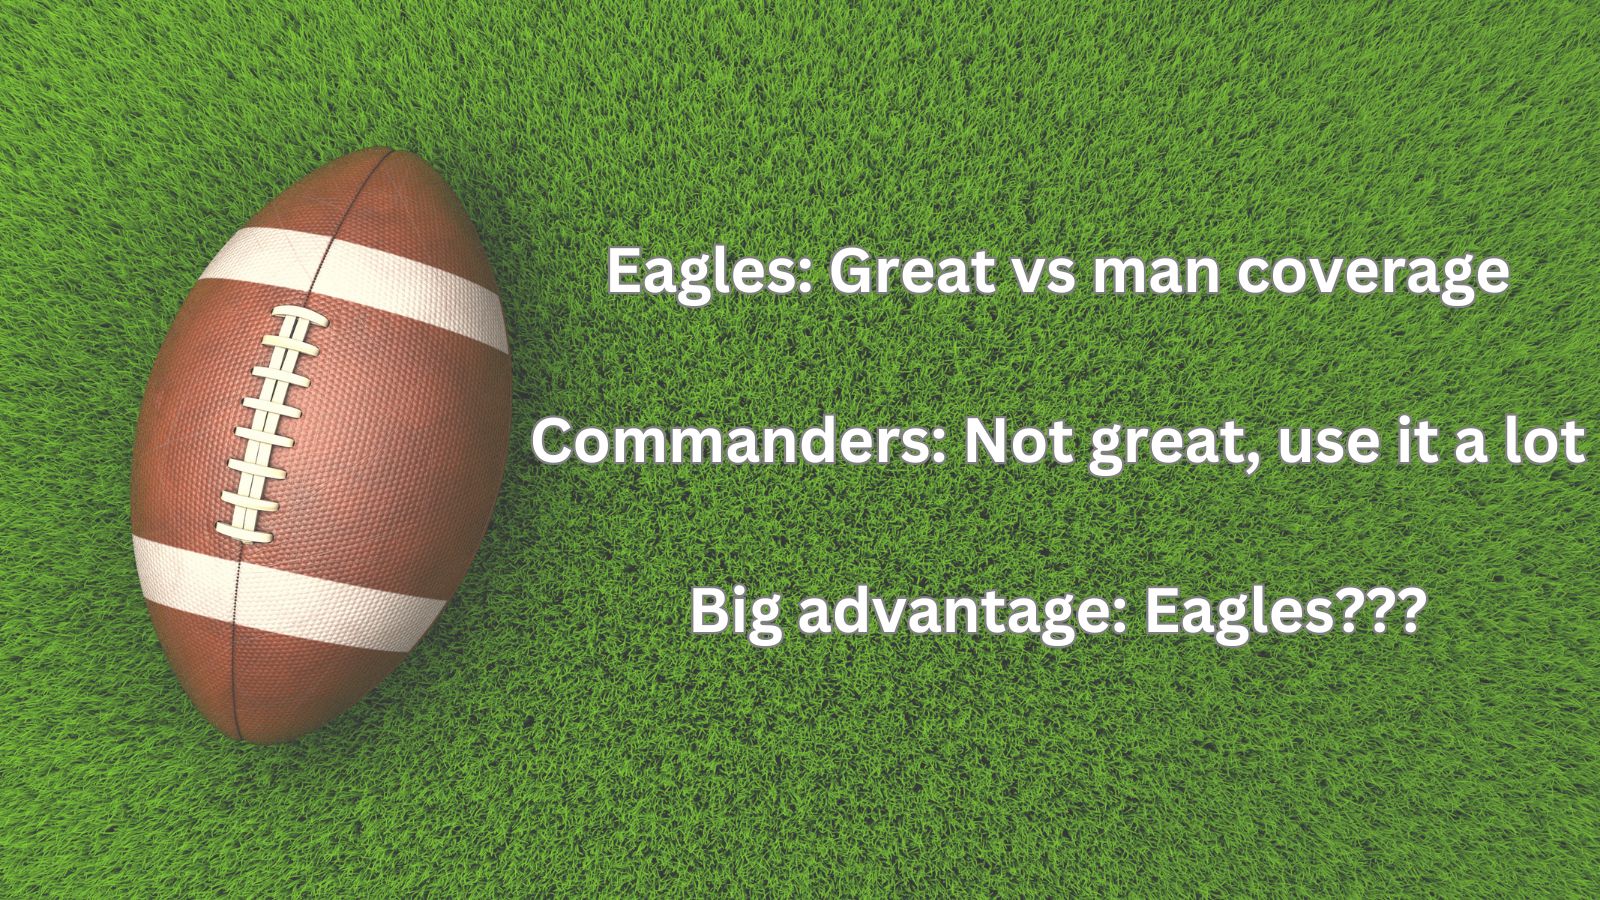
The Commanders defense is 3rd in man coverage usage this year. The Eagles offense is 2nd in success rate* against man coverage, conveniently enough. And Washington’s 23rd defensively.
The Commanders are 7th in middle-of-the-field closed (MOFC, i.e. single-high) coverage usage. The Eagles are 3rd in success rate against single-high, and Washington is 19th defensively.
Success rate = The percentage of plays where the offense’s expected points improved as a result of the play (explanations of expected points can be found in many places, including this article explaining our Total Points stat)
Huge mismatch alert, right? Welllll…
Over the last four seasons, there have been a handful (or three) of examples each of similar mismatches late in the year (big gap in ranks, common split for the defense). In those spots we’d expect the offense to feast, potentially with a higher success rate than their average because they’re playing a below-average defense.
But that’s not what we find. The in-game success rate is a good bit lower than what both teams had produced prior.
Results in games with mismatches significantly favoring the offense, 2021-24 Weeks 13+
| Vs Man Coverage | Vs MOFC | |
| Games | 11 | 15 |
| Offense Previous Success% | 51% | 52% |
| Defense Previous Success% | 47% | 52% |
| Game Success% | 41% | 47% |
And this isn’t just an isolated phenomenon. I identified dozens of splits—coverage, blocking scheme, run direction, personnel, etc.—and looked for late-season mismatches based on previous performance. This includes games where the defense should be expected to dominate. And the results look similar, albeit a bit tempered.
Results in games with mismatches, by mismatch type. 2021-24 Weeks 13+
| Favors Offense | Favors Defense | |
| Games | 1632 | 1453 |
| Offense Previous Success% | 51% | 40% |
| Defense Previous Success% | 50% | 40% |
| Game Success% | 47% | 41% |
I take three interpretations from this. I’ll lead with the simplest one that is worth mentioning in lots of situations.
Sample size, regression, etc.
All of the included mismatches and splits had reasonably robust sample sizes associated with them. Each individual team’s history in a given split might not be super large, but aggregated over the whole league we get hundreds and thousands of plays to work with.
However, everything in football is to some extent a small sample. Each team only gets a few dozen passes and a couple dozen runs a game. To analyze anything, you either have to take those results in aggregate and bundle up a bunch of dissimilar plays, or you have to isolate more homogenous but smaller splits. Even having 12 weeks of data in-season and some 50 plays in a fairly refined split is a pretty small amount. So it’s fair to assume that simple regression to the mean plays a big part in mismatches not manifesting in the aggregate.
Football is a cat-and-mouse game
Coaches and players engage in constant retooling week to week. Most of these advantages and disadvantages are known to both teams, so they’re each accounting for it (and expecting their opponent to do the same). Highlighting your strengths, nudging away from your weaknesses, avoiding your opponent’s strengths, attacking their weaknesses, all of these tactical gambits happen each week to jumble up the puzzle of figuring out what’s going to happen in a given game.
Stats don’t stand on their own
I think this finding emphasizes the value of the interaction of data analysis and film study. I was able to programmatically identify thousands of mismatches between teams in the span of a few minutes. But each of those mismatches has a story behind it, an understanding of the personnel and coaching that can inform the extent to which those findings are bankable going forward.
Take the Eagles/Commanders passing game splits from above. We know that these teams have played twice already this year. In those games, the Commanders ran Cover 1 (man coverage with a single high safety) 52% of the time. That was nearly double their rate from other games. And in the game that mostly featured a limited passing game (Kenny Pickett at quarterback), they were even more Cover-1-heavy. So we can feel more confident this split will be prevalent in this matchup.
But the Commanders also had substantially different performances in Cover 1 from game to game. The Eagles had a 57% success rate against it in their Week 11 win, which contributes substantially to their overall excellence in the man and single-high splits (and the Commanders’ struggles). But in the Pickett game they had just a 39% success rate, and even if Hurts plays, his recent performance suggests that his effectiveness will be closer to that of Kenny Pickett.
So while the above splits are informative of what the game might look like, they’re not necessarily informative of how it’ll work out in a single game. Each time we do any research or cite any stat, we should take it as a conversation starter rather than as a conversation ender


