Have thoughts on Stat of the Week or any of the content that Sports Info Solutions produces? We’d like to hear from you. E-mail Mark@sportsinfosolutions.com and share your perspective.
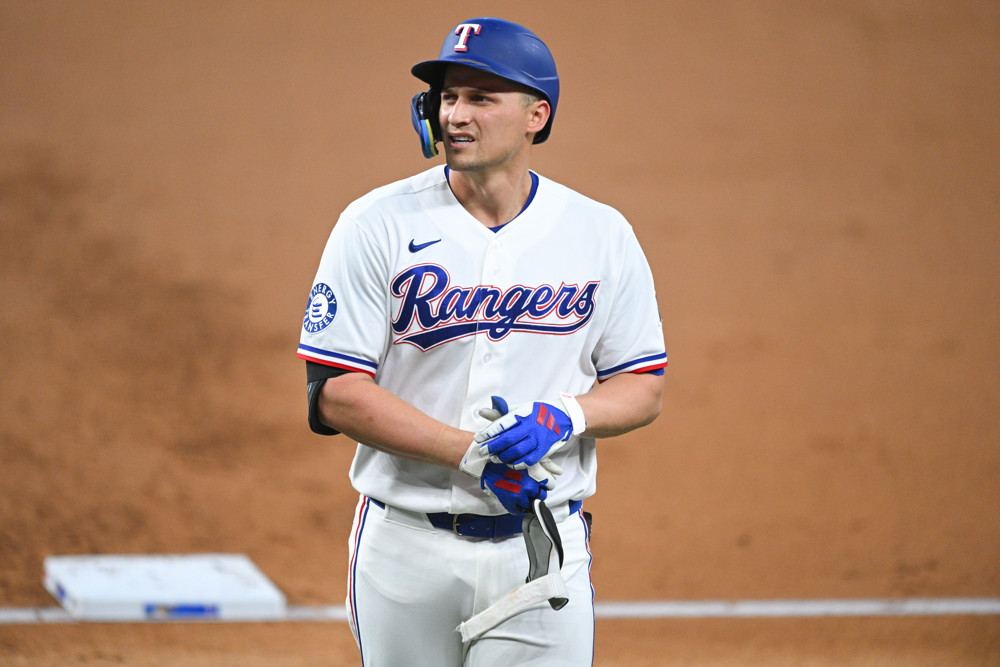
Rangers shortstop Corey Seager deserved better than what he got in 2026.
Seager hit .227 with a .736 OPS and 20 home runs in 102 games but you could make a case that his results should have been as good as those of 2024 and 2025.
Sports Info Solutions tracks its own version of a player’s expected stats (similar to what you can find on Baseball Savant). Rather than basing a player’s hit probability (and subsequently single, double, triple, and home run probability) on a batted ball’s exit velocity and launch angle, SIS’ version estimates probabilities based on where balls are hit, how hard they are hit, how long they spend in the air, and the speed of the batter, as well as the ballpark in which the ball was hit.
This allows us to compare a player’s actual stats to his expected stats.
Seager underperformed his expected numbers by 43 points in batting average, 97 points in slugging percentage, and 135 points in OPS. Here’s what he should have been versus what he actually was.
Corey Seager – 2026 Actual vs Expected
|
|
Actual |
Expected |
|
BA |
.227 |
.270 |
|
Slug |
.424 |
.521 |
|
OPS |
.736 |
.871 |
Seager has the misfortune of playing in one of the worst parks for hitters in the majors in Globe Life Field, though this was the first year he seemed hindered by it. His OPS at home the last three seasons was .857, .876, and .644.
Perhaps not surprisingly, the disparity between his actual and expected stats was more stark at home than on the road.
Corey Seager – Actual vs Expected at Home
|
|
BA |
Slug Pct |
|
Actual |
.221 |
.368 |
|
Expected |
.277 |
.500 |
Here’s the leaderboard for the hitters with the biggest negative differential between their actual and expected OPS, among hitters with at least 300 plate appearances. Seager is at the top.
Biggest Negative Differential – Actual OPS and Expected OPS
|
Name |
Actual |
Expected |
Differential |
|
Corey Seager |
.736 |
.871 |
-.135 |
|
Geraldo Perdomo |
.747 |
.859 |
-.112 |
|
Tim Tawa |
.689 |
.799 |
-.110 |
|
Zach McKinstry |
.582 |
.674 |
-.092 |
|
J.T. Realmuto |
.614 |
.695 |
-.081 |
|
Lane Thomas |
.702 |
.781 |
-.079 |
|
Jarren Duran |
.627 |
.705 |
-.078 |
|
Mookie Betts |
.780 |
.858 |
-.078 |
|
Xander Bogaerts |
.676 |
.749 |
-.073 |
|
Patrick Bailey |
.607 |
.678 |
-.071 |
|
Kyle Tucker |
.715 |
.786 |
-.071 |
Good defense has at least a little something to do with just about all of these players, though underperformance could occur for other reasons or just bad luck.
Diamondbacks shortstop Geraldo Perdomo was second to Seager, with an actual OPS of .747, 112 points below his expected OPS. Had Perdomo hit something close to his expected OPS, he would have nearly matched his actual 2025 numbers (an .851 OPS).
I wrote about Perdomo’s loss of potential hits to great defense a couple of weeks into the 2026 season. That leveled off a bit as the season went on, but defenses still had 11 Runs Saved against him. He was one of 15 players with at least that many Runs Saved against him.
Perdomo’s teammate, Tim Tawa, also made the actual vs expected OPS leaderboard with his .689 actual OPS 110 points below his expected OPS.
Speaking of teammates, you’ll see two pretty big names from the Dodgers on the leaderboard above in Mookie Betts and Kyle Tucker.
In Betts’ case, defenses had 10 Runs Saved against his batted balls, which may account for his season output being below expectations (though his OPS was higher than it was in 2025).
Tucker had full-season career worsts in batting average (.233) and OPS (.715). He too had big trouble in his home ballpark, hitting .196 with a .592 OPS at Dodgers Stadium. He was much closer to his usual self in road games (.269 batting average, .833 OPS).
Of the 10 players on last year’s list, six of them had higher OPS’ in 2026 than they did in 2025, all by at least 50 points. The big jumpers were Tyrone Taylor (.598 to .827), Luis Garcia Jr. (.701 to .831), and Otto Lopez (.672 to .786).
Caveats abound here. Just because Seager, Perdomo, Betts, Tucker, and the others on this list could have been better in 2026 doesn’t necessarily mean that they will be better in 2027. But if you believe in a player on this list and are looking for reasons to feel good about them, then these numbers should provide you some comfort.