Sports Info Solutions
Category: MLB
-
Hall of Fame Value Standard shows Mike Mussina’s worthiness
By
Bill James has a new stat and an old stat that shows Mussina’s value well.
-
Job Opening: Minor League Video Editor Internships
By
SIS has openings for a seasonal baseball-related position.
-
By the numbers, Scott Rolen is Hall-of-Fame worthy
By
Rolen’s combination of offense and defense make him highly regarded at an undervalued spot.
-
Stat of the Week: Year-End MLB Awards Part II
By
Last week, we gave out some year-end MLB Awards to hitters, infielders, and outfielders. This week, we’re specifically rewarding the work of pitchers and catchers. Here are some honors that celebrate their outstanding performance. The Contact Minimizer The Contact Minimizer goes to the pitcher who limited hard contact best in 2018. The winner of that…
-
Stat of the Week: 2018 Year-End Awards
By
We’re nearing the end of the year, so this seems like an appropriate time to bestow some statistically-driven baseball awards for 2018. These will round out the awards already given by the BBWAA. Without further ado… The Hard-Hitter Award Baseball Info Solutions charting is such that every batted ball is deemed hard, medium or soft-hit,…
-
The Hall of Fame Value Standard
By
Bill James devised a means to evaluate whether a player is Hall-of-Fame worthy.
-
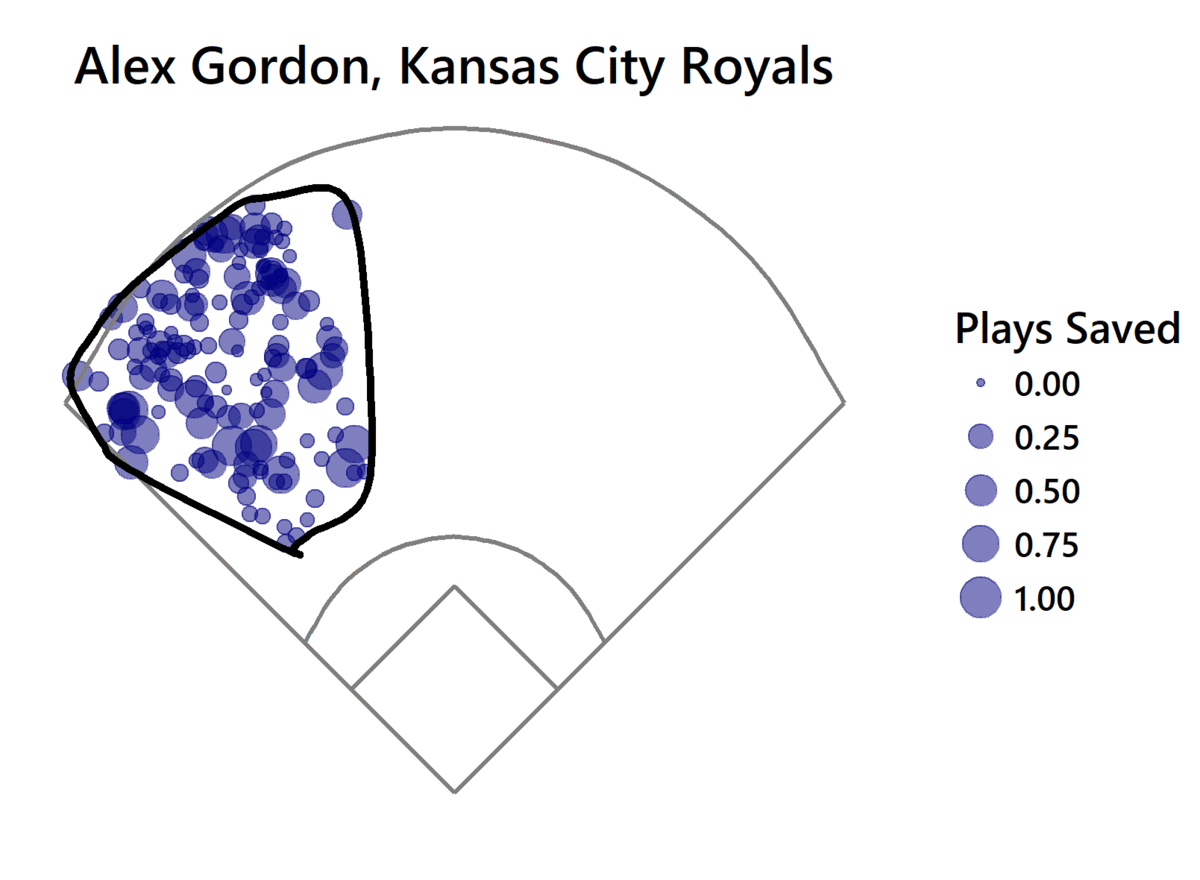
Visualizing the Range of MLB’s Best and Worst Outfielders in 2018
By
By ANDREW KYNE The primary component of Baseball Info Solutions’ Defensive Runs Saved metric is the Range & Positioning system, which rates each fielder’s success at converting batted balls into outs. Fielding Bible Award winners Alex Gordon (LF), Lorenzo Cain (CF), and Mookie Betts (RF) were among the best at their respective positions in 2018…
-
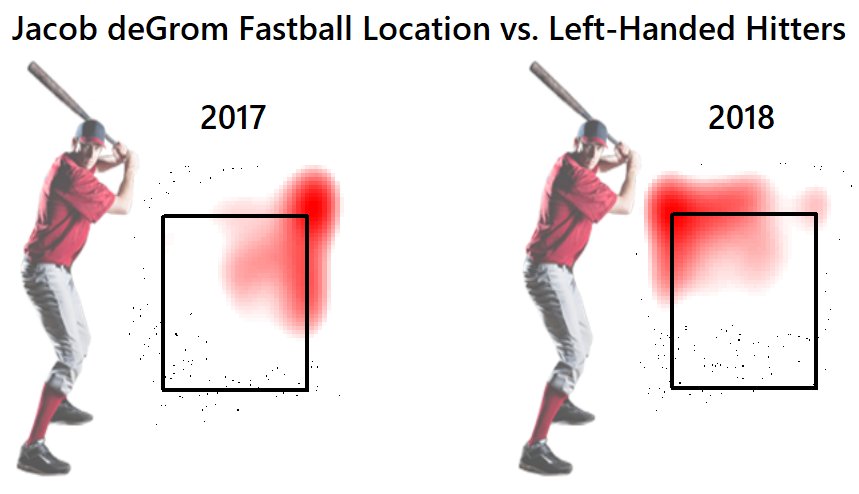
The changes that made Jacob deGrom and Blake Snell Cy Young worthy
By
By MARK SIMON Pitchers are always making tweaks and adjustments to their deliveries and repertoires in an effort to stay a step ahead of the hitters. In the case of Mets pitcher Jacob deGrom and Rays pitcher Blake Snell, the tweaks made those pitchers Cy Young worthy. DeGrom’s big adjustment came by suggestion from pitching…
-
Who were the top performing defensive rookies in 2018?
By
Harrison Bader was among those who led the way, but there are a couple of names here you probably didn’t expect or know.
-
Open the Handbook and let the numbers tell the story
By
The Bill James Baseball Handbook is 622 pages of baseball goodness. Here are some of our favorite tidbits.