Sports Info Solutions
Category: Baseball
-
Study: What’s a Small Sample of Defensive Stats Worth These Days?
By
Can we trust a small sample of defensive performance for a new full-time player?
-

Reimagining The 2022 Yankees & Giants as Average Defensive Teams
By
Strat-O-Matic helped us create an alternative baseball world for the best & worst defenses in MLB. How’d these teams fare?
-

What Has 20 Years of Defensive Runs Saved Data Meant to Baseball?
By
Measuring defense in a new way can help make a Hall of Famer, start or extend a playing career, debunk myths, and teach us things we didn’t know.
-
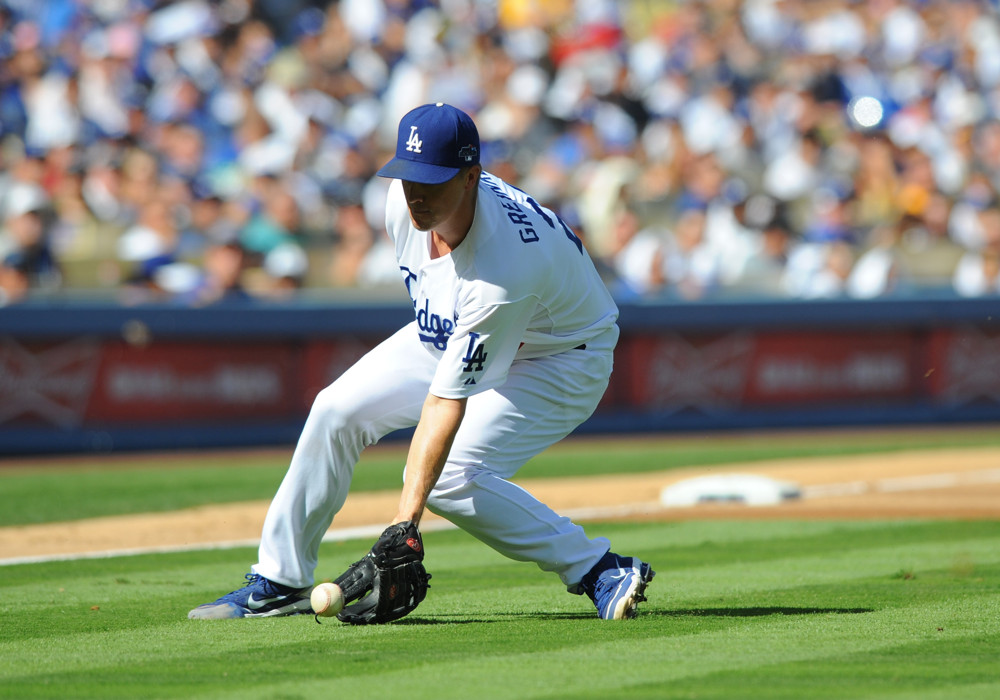
Stat of the Week: Zack Greinke’s Defense
By
In the 20-year history of Defensive Runs Saved, no pitcher has saved more runs than Greinke has.
-
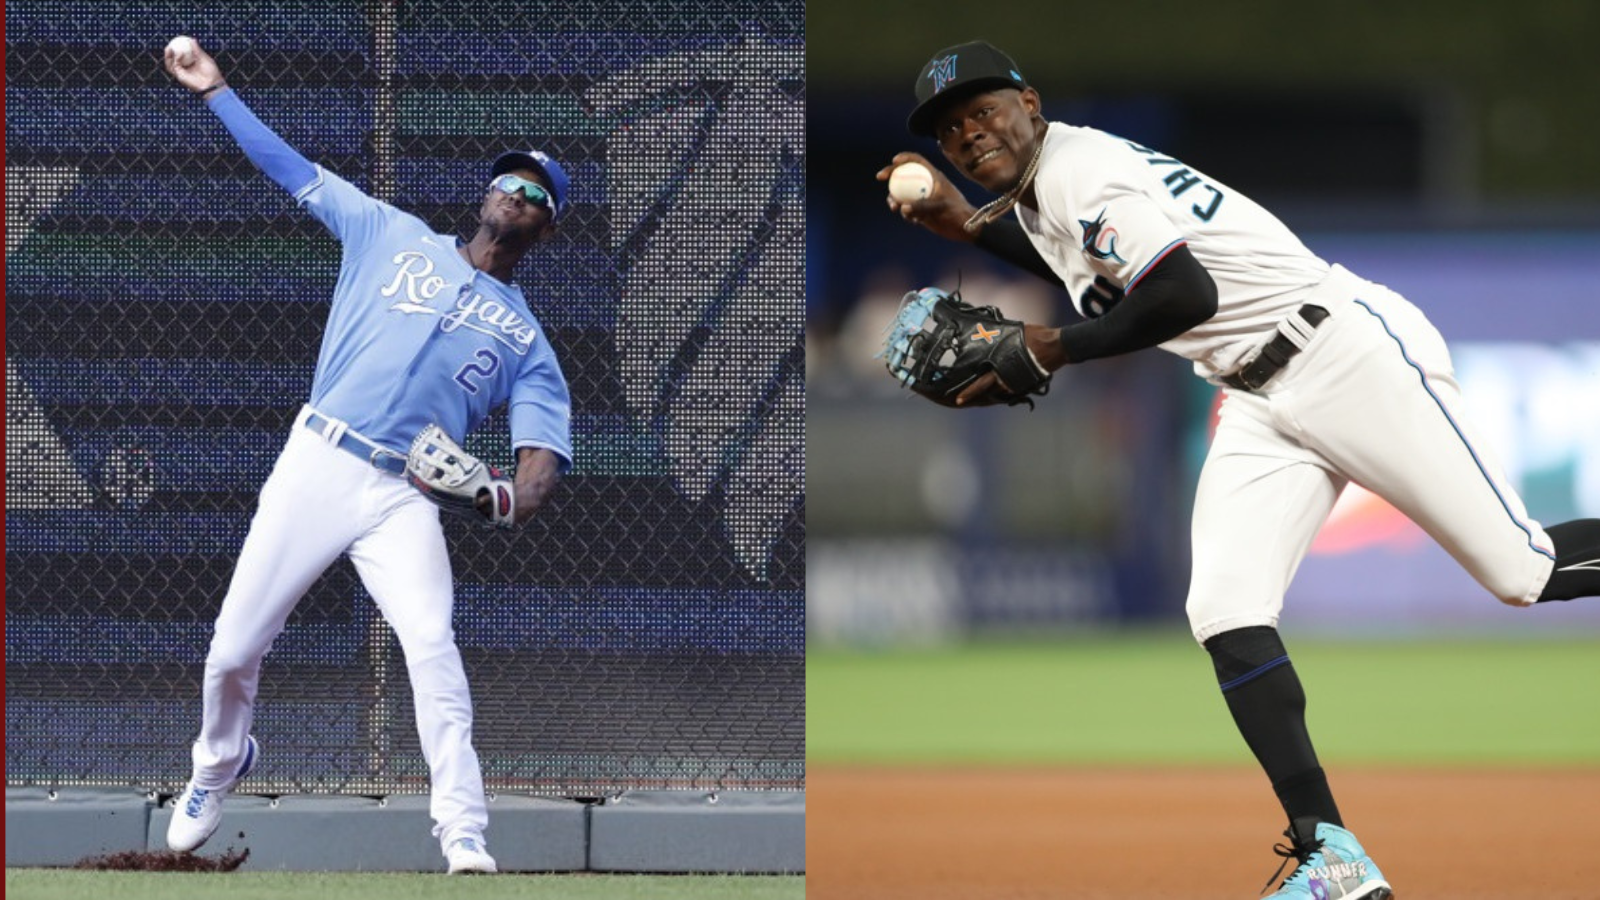
CF Defense In The News: The Current King & The Aspirant
By
Michael A. Taylor and Jazz Chisholm were in the news this week. A closer look at a trade and a position switch.
-

Stat of the Week: 2024 Baseball Hall of Fame Ballot
By
Adrián Beltré is a clearcut choice, but how do others stack up?
-

The Best Outfielders in Defensive Runs Saved Per Inning
By
Remember how aggressively Sam Fuld and Brett Carroll played defense? There was a good payoff for that.
-
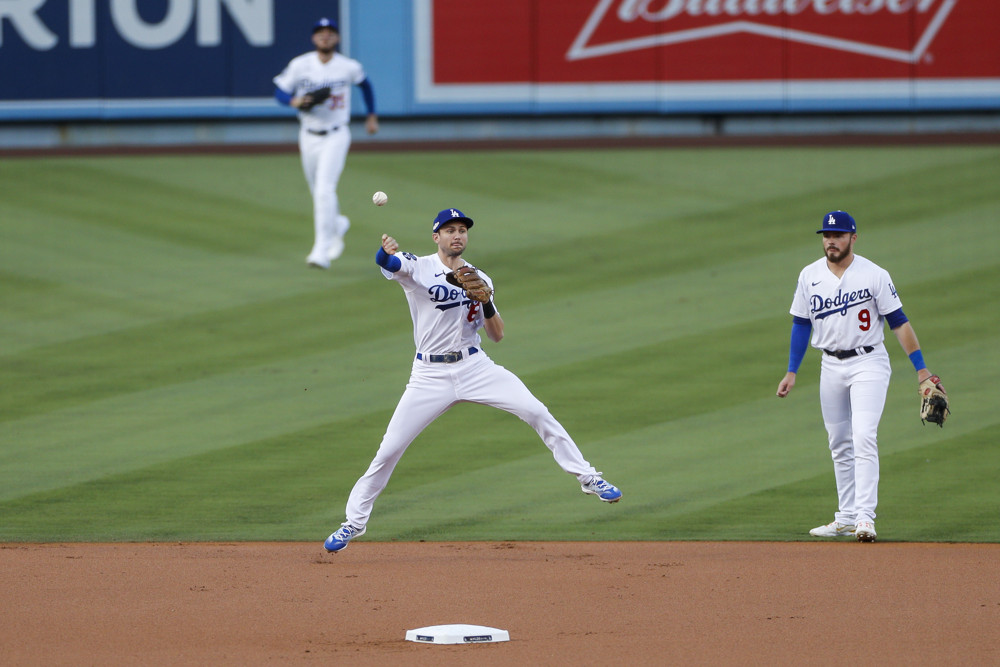
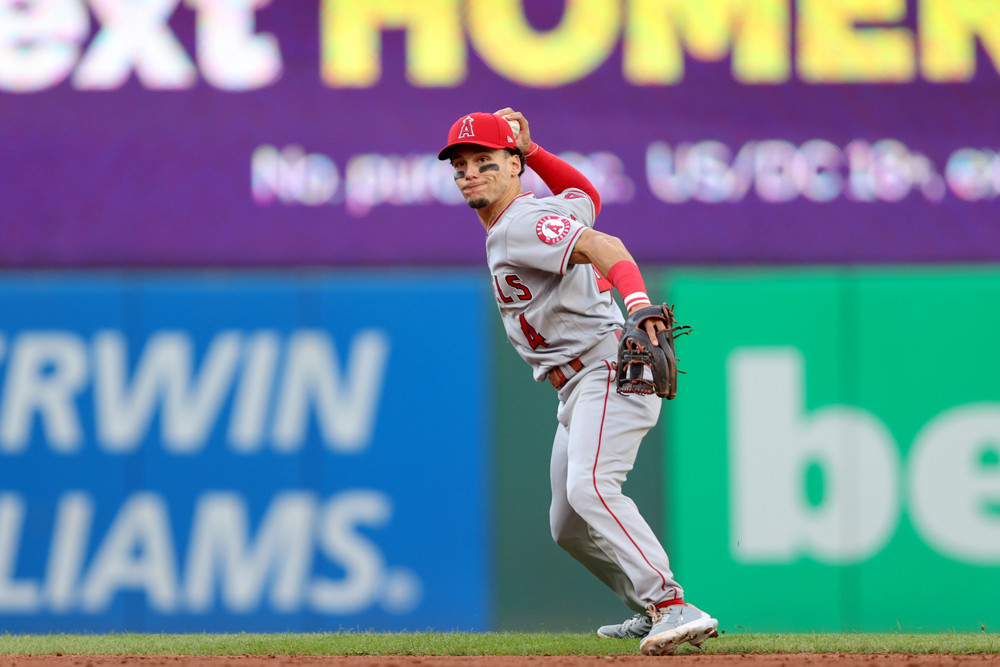
Stat of the Week: How Trea Turner Impacts The Phillies Defense
By
Turner rates as an average shortstop by our measures – and that will be a big improvement!
-
The Cubs Badly Needed a Defensive Upgrade in CF
By
Cody Bellinger rated as an average CF the last 2 seasons – but if he can handle the Wrigley wind, that’s a huge improvement on what the Cubs had.
-
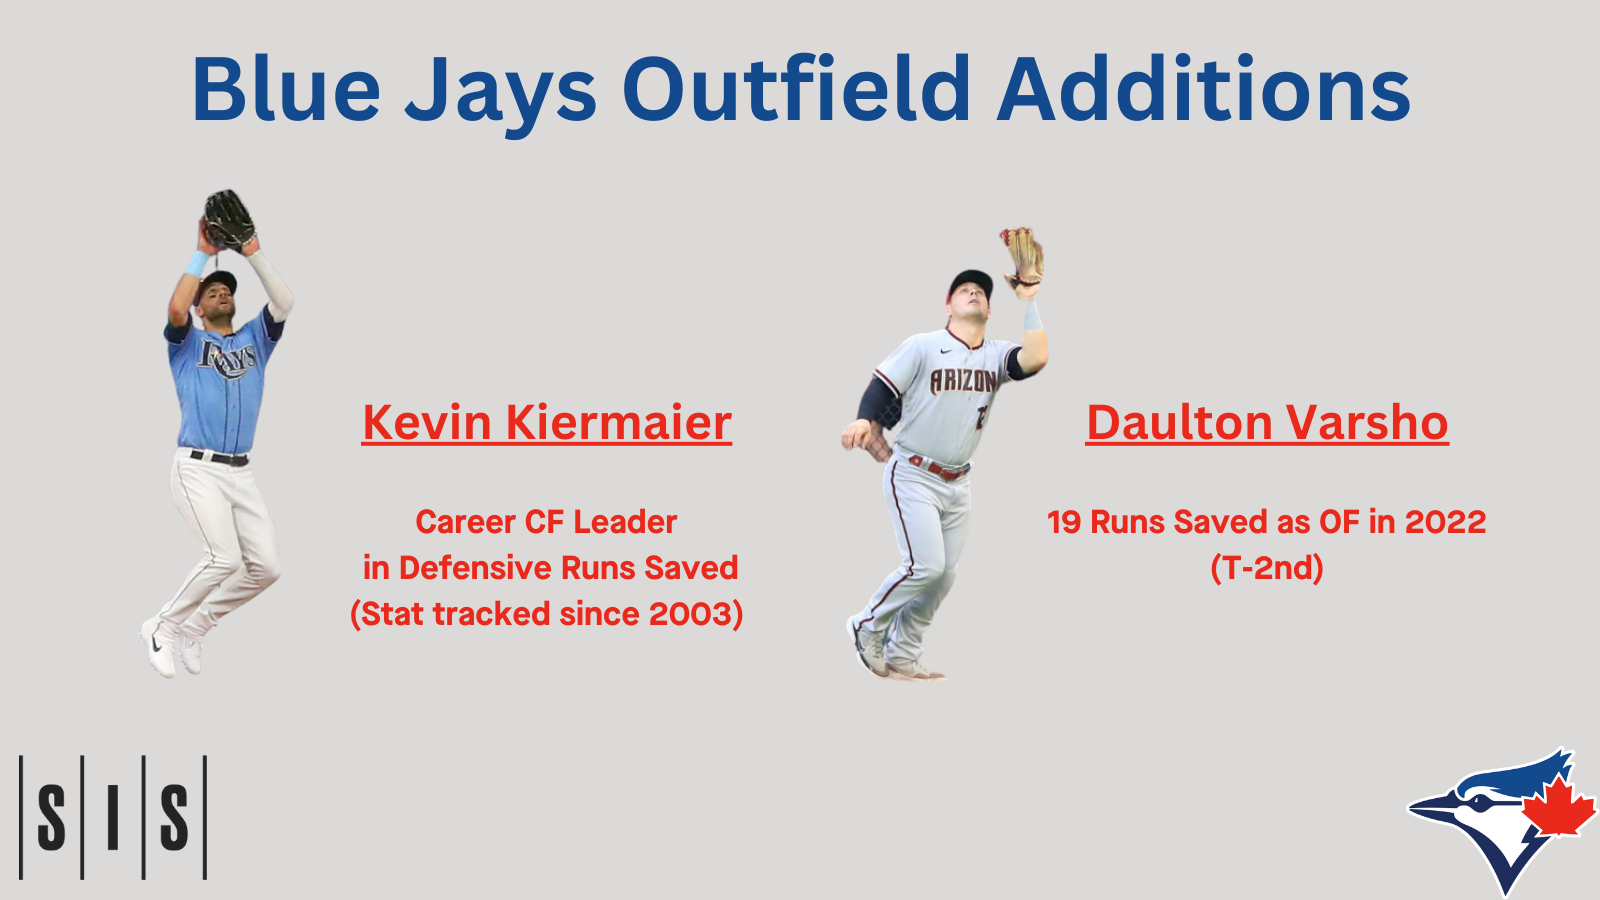
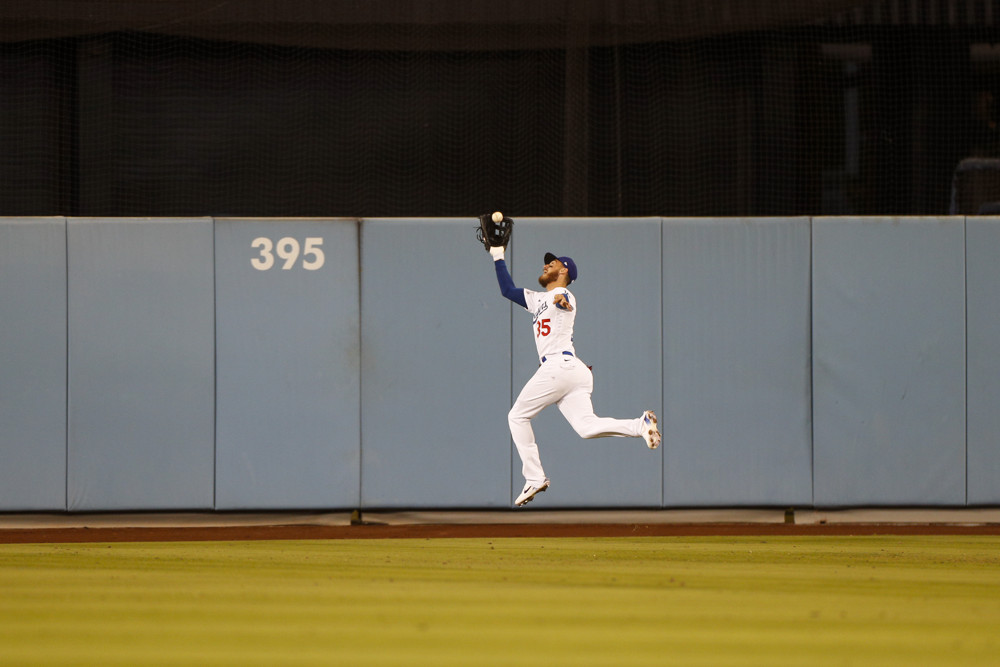
Stat of the Week: The Remaking of the Blue Jays Outfield
By
The Blue Jays have added pieces that – if things break right – could make them one of the best defensive teams in 2023.