Sports Info Solutions
Category: NFL
-
Stat of the Week: No. 1 Team Entering NFL Playoffs: The Ravens
By
A one-week respite from baseball to look at how one of our stats assesses the best team in another sport.
-
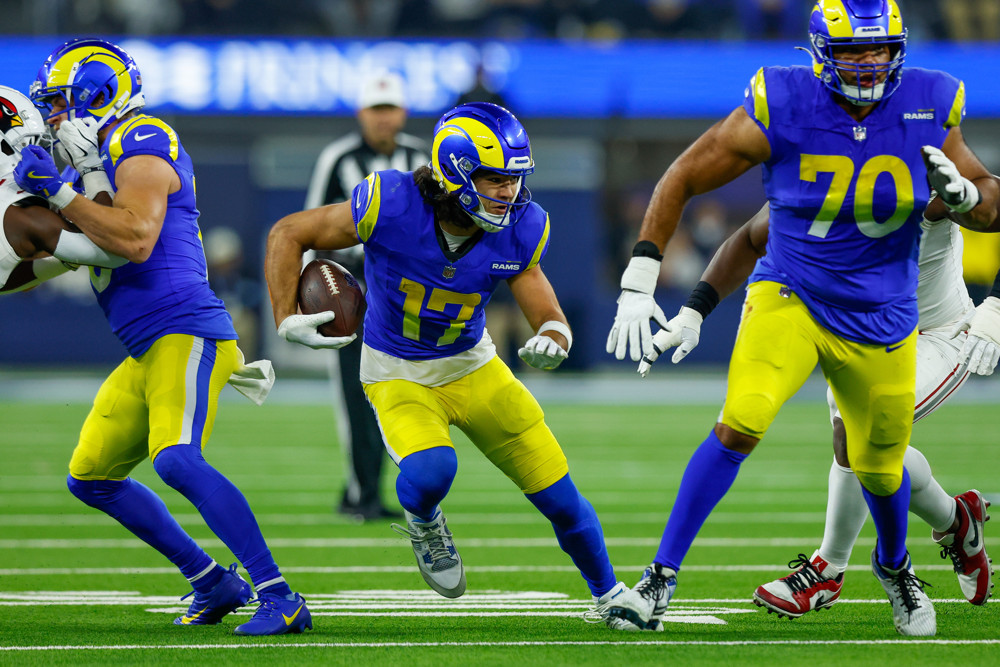
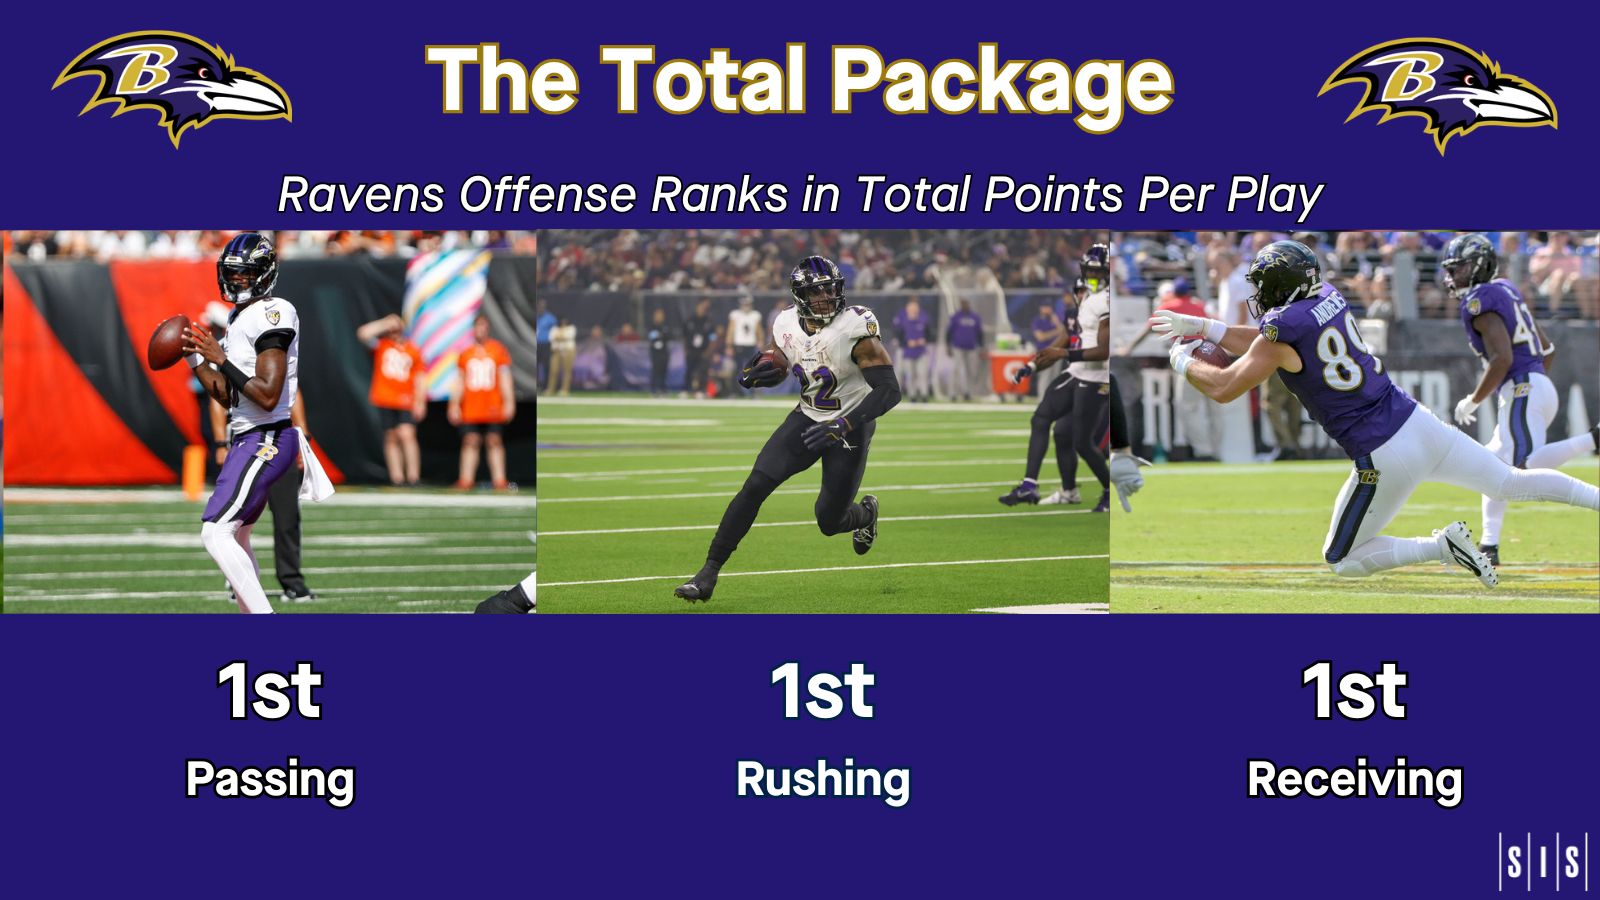
NFL Advanced Stat Leaders Entering Week 18
By
Puka Nacua of the Rams is our leading receiver by our Total Points player value stat. Find out who the other leaders are in our that stat and which teams rate best overall and in different areas.
-
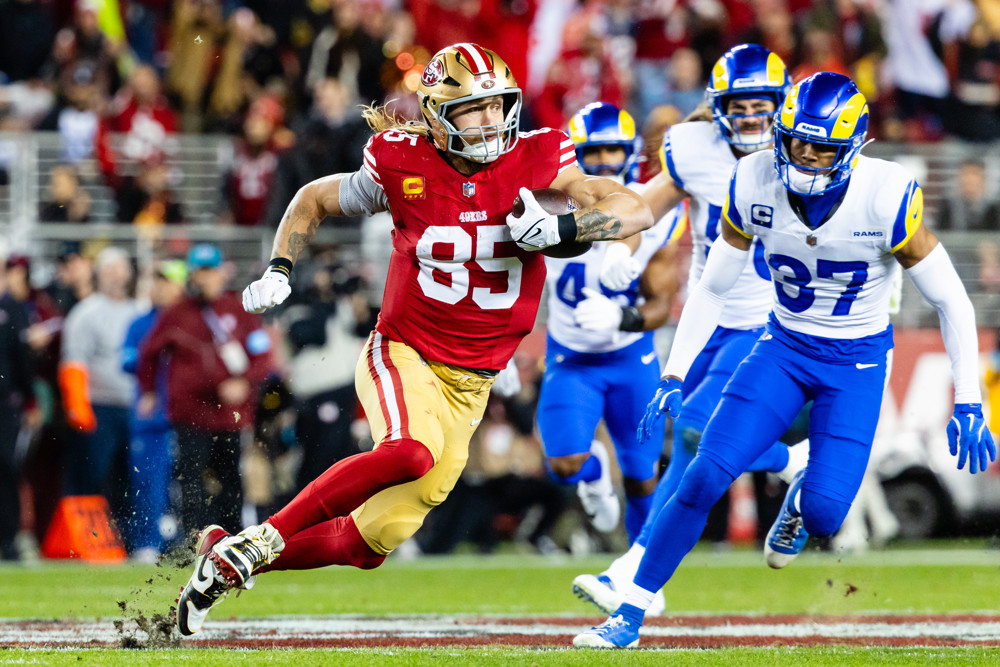
NFL Advanced Stat Leaders Entering Week 17
By
It’s been a tough year for the 49ers, but George Kittle is among our top statistical performers by our player value stat Total Points. See who else joins him across the NFL.
-
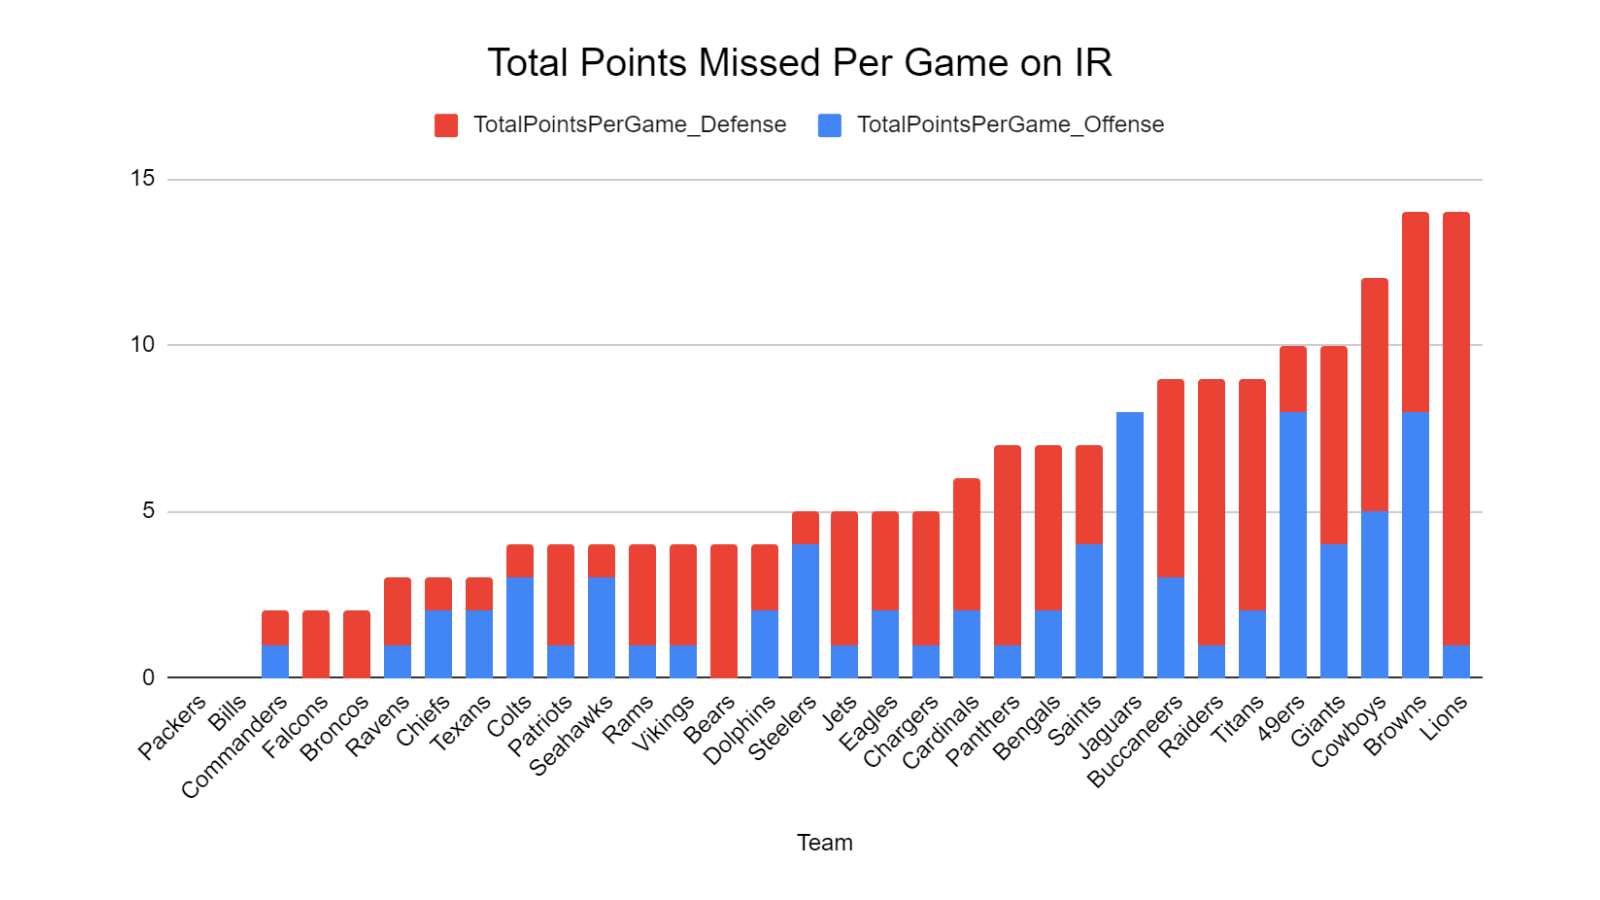
Which NFL Teams Have Been Most and Least Impacted By Injuries?
By
Of the teams LEAST impacted by injuries, 9 of the top 10 in our ranking are in playoff contention, but what about those most impacted?
-
NFL Advanced Stat Leaders entering Week 16
By
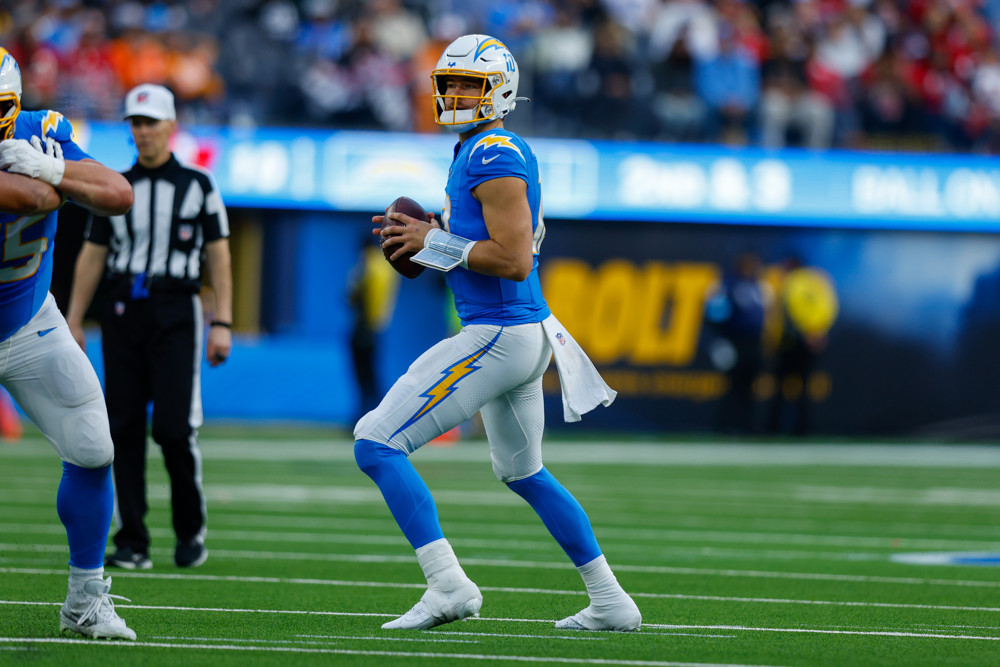
Justin Herbert leads quarterbacks in one aspect of deep ball passing. Who else makes our list of advanced stat leaders?
-
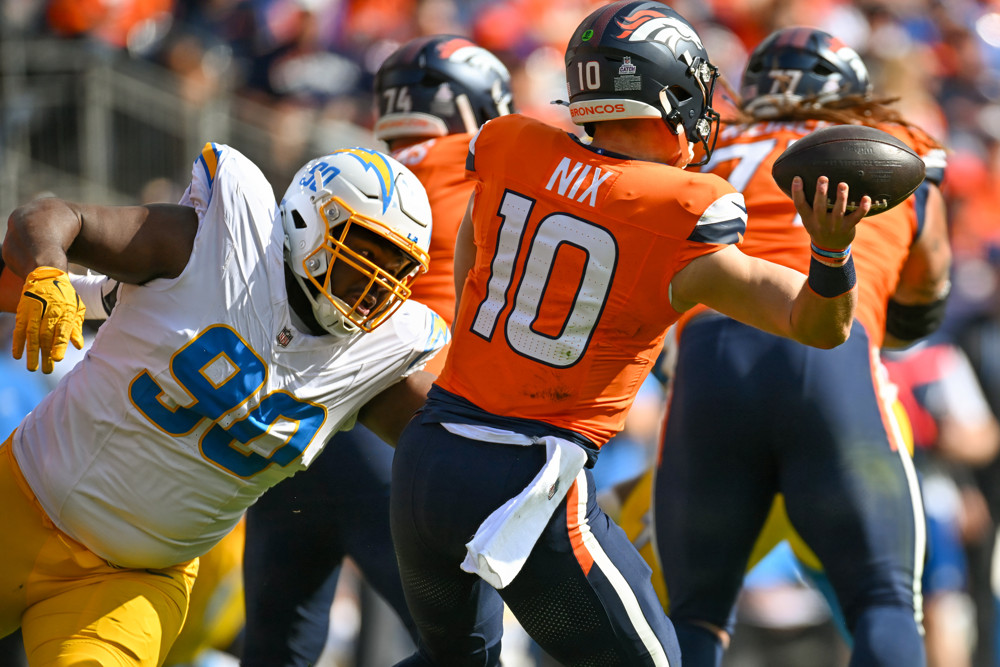
Should Bo Nix be in the Rookie of the Year conversation?
By
The surface-level stats don’t make you think he should. But consider the team context in which he’s operating.
-
NFL Advanced Statistical Leaders Entering Week 15
By
Christian Gonzalez rates as the No. 1 cornerback in the NFL in our player value stat entering Week 15. Who else is among the positional leaders (and many more numbers)
-
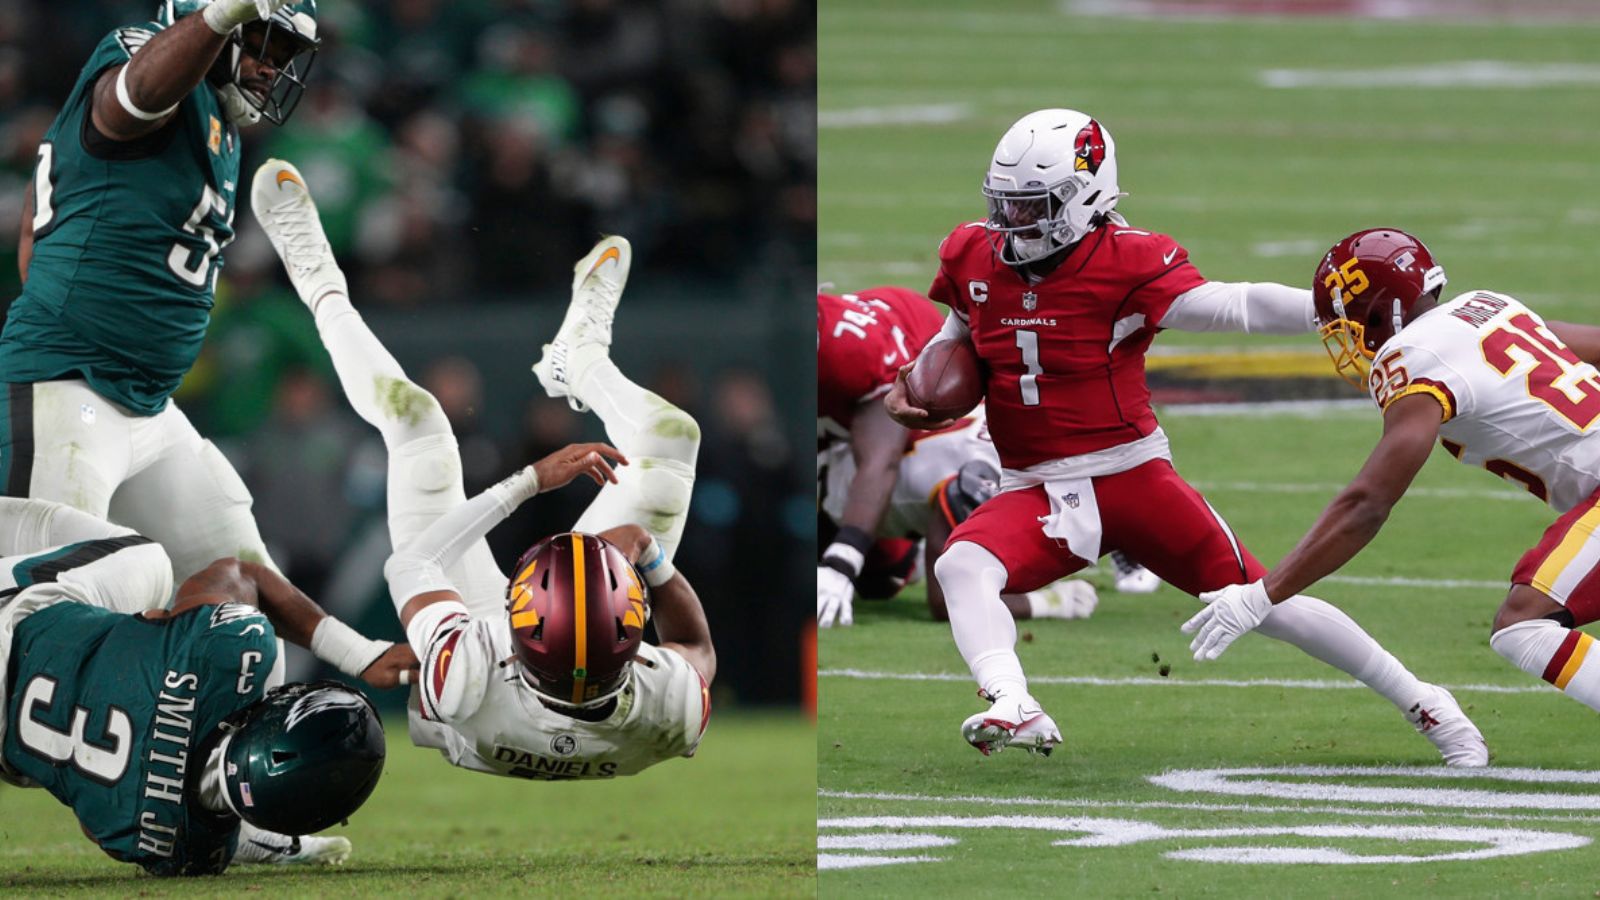
We’ve Seen This Before From Kliff Kingsbury
By
What has happened to Jayden Daniels resembles what previously happened to Kyler Murray.
-
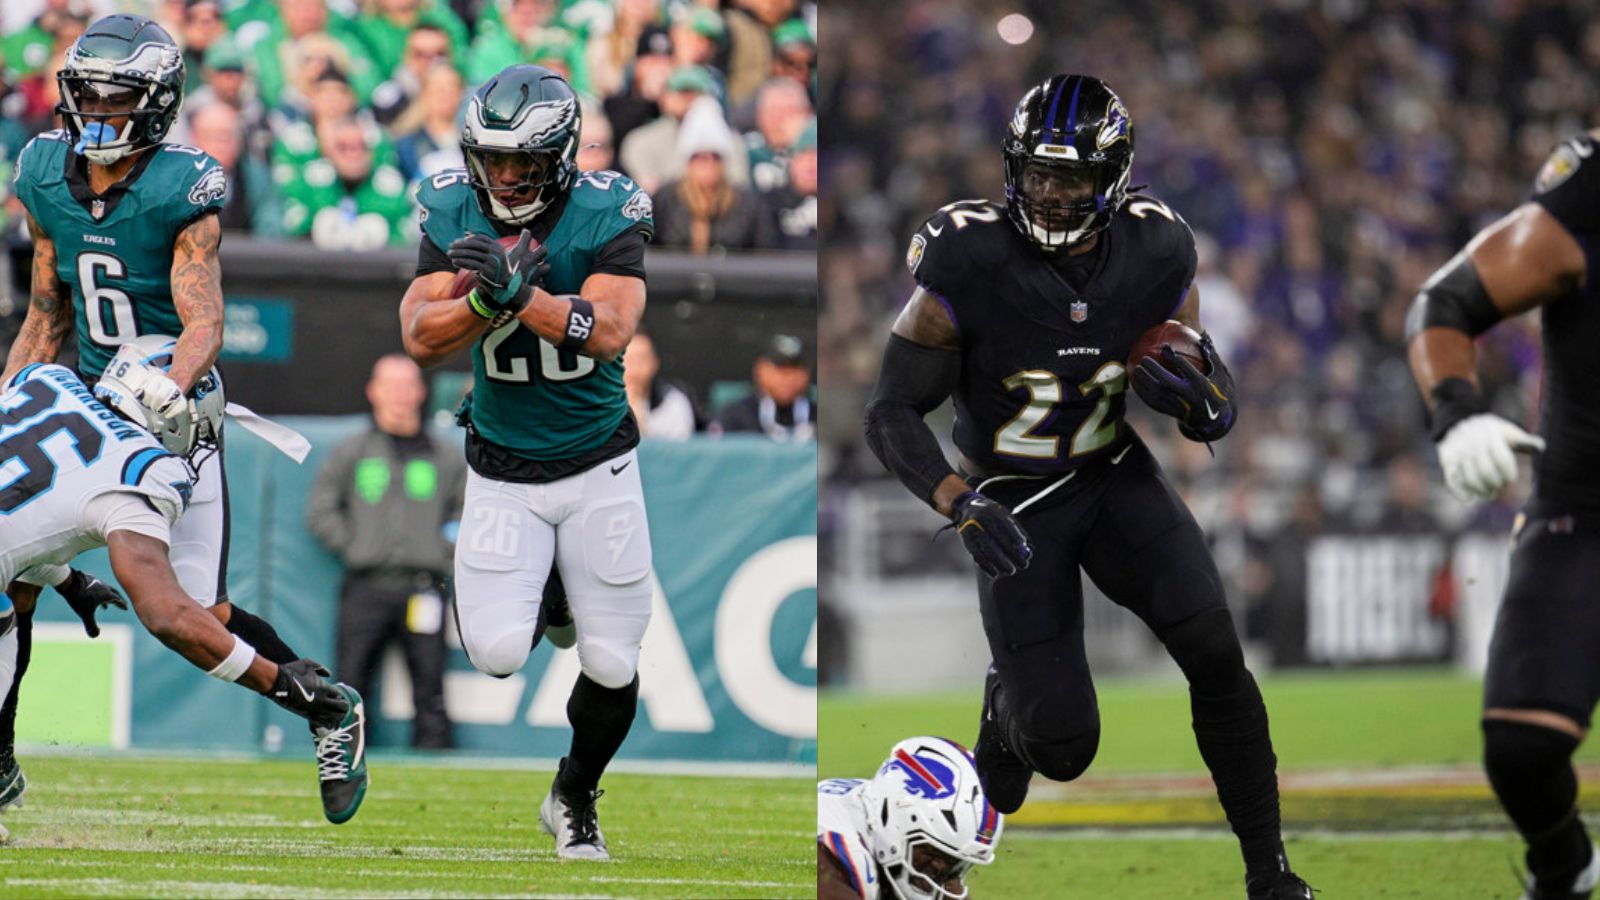
Running Backs Matter … Again?
By
Saquon Barkley, Derrick Henry and Josh Jacobs are changing the narrative
-
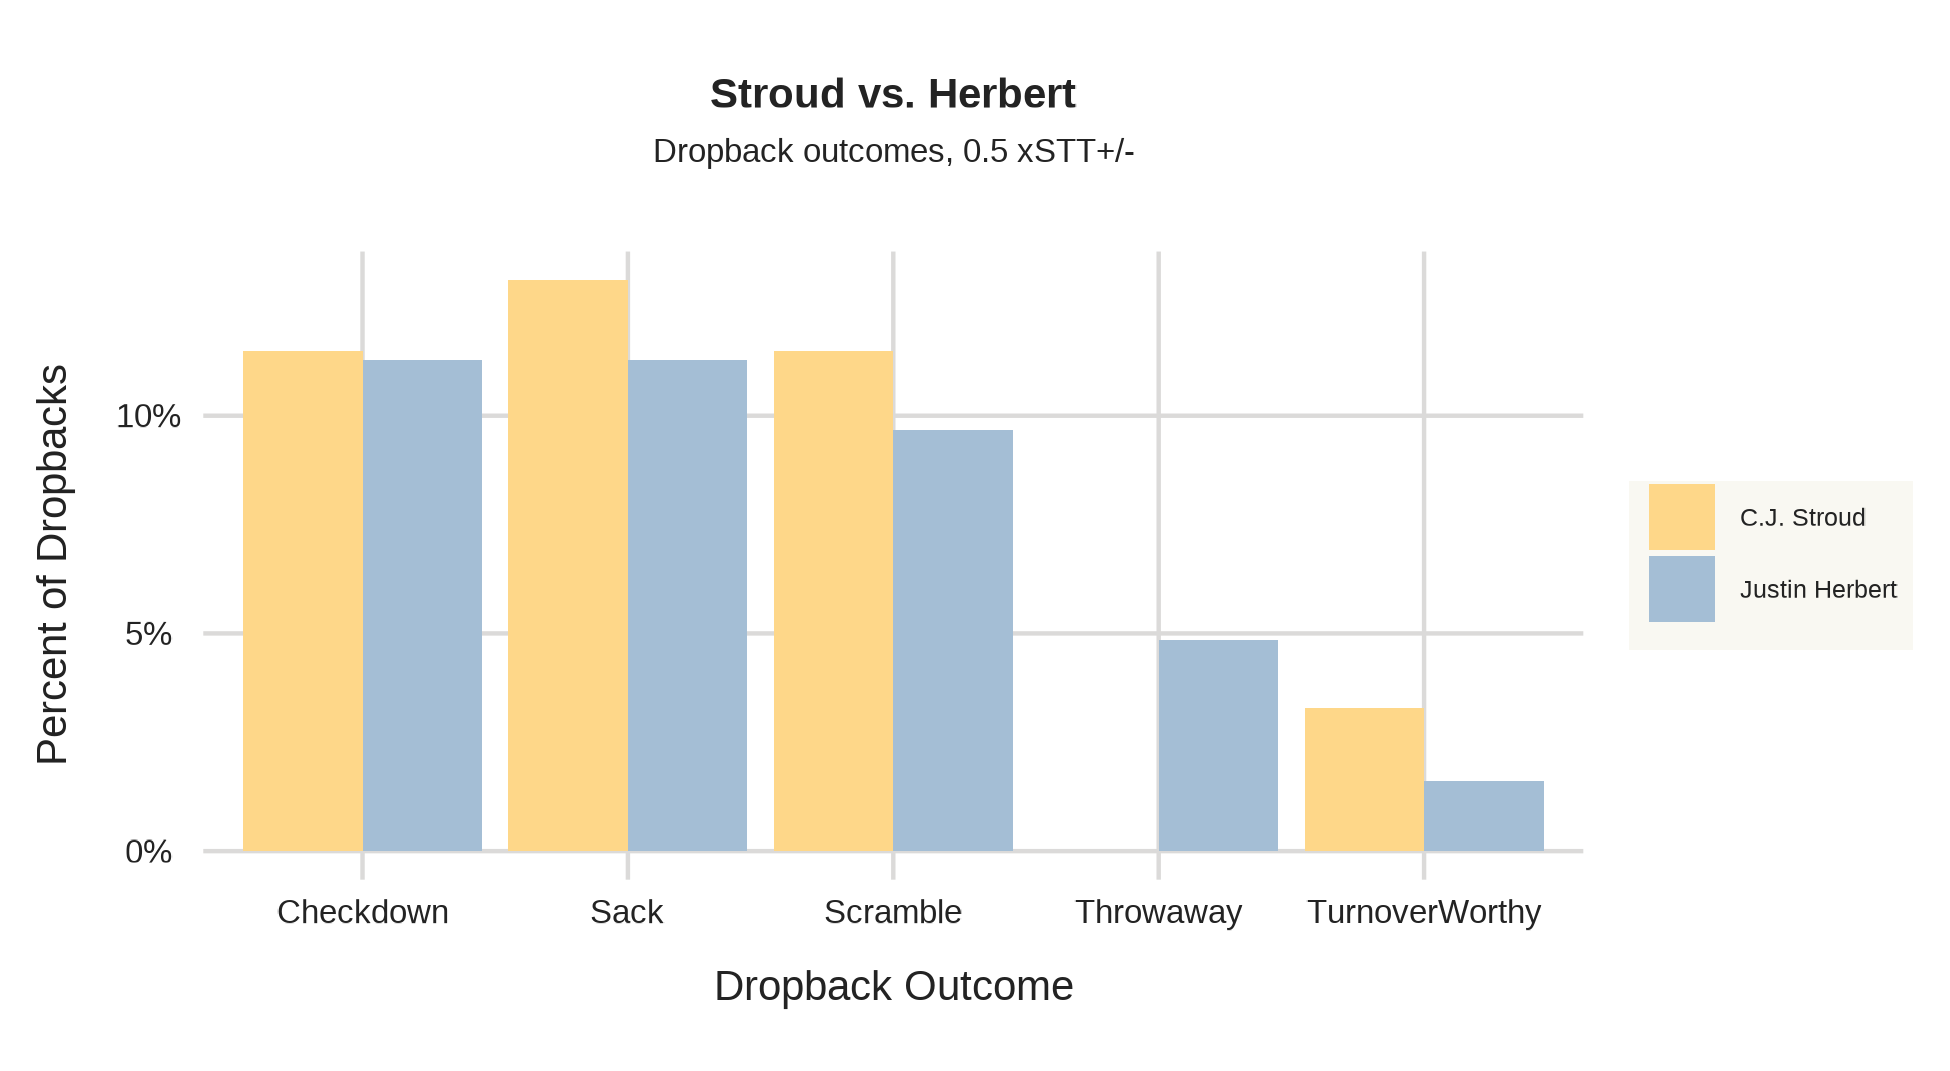
Chaos Manifest: Measuring How QBs Behave as Passing Plays Break Down
By
Introducing Expected Snap to Throw +/- (xSTT+/-) as a way of looking at dropback outcomes.