Sports Info Solutions
Category: MLB
-
Athletics got an ‘A’ for their shift defense in 2018
By
The Athletics were among the best in the majors, even though they didn’t do it all that often.
-
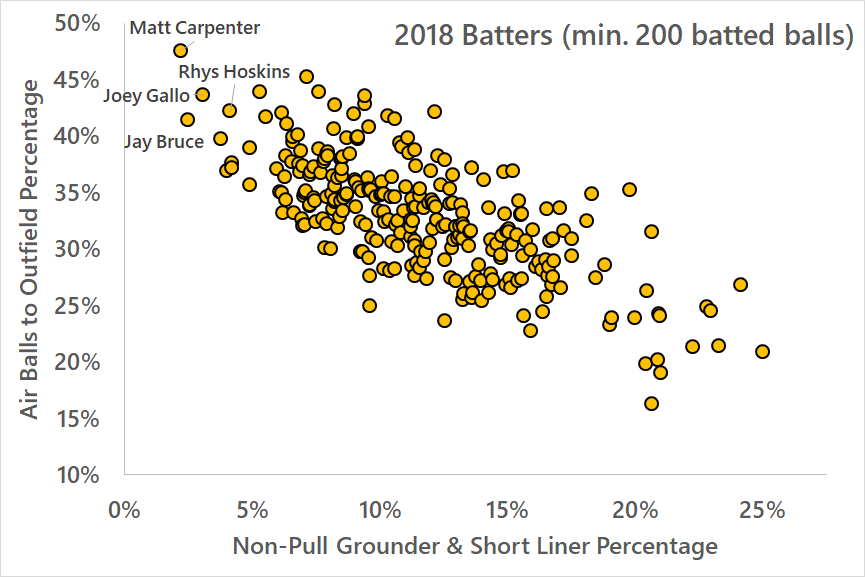
Finding Candidates for a Four-Man Outfield
By
Four-man outfields may be more common in 2019. Which hitters are candidates to face the strategy?
-
Stat of the Week: Running on Bryce Harper’s arm
By
Teams ran on Bryce Harper with a lot of success last season. But he wasn’t the only superstar with that issue. Here’s a look at the leaders/trailers in outfield arm effectiveness.
-
Citizens Bank Park is ideal for Bryce Harper’s power.
By
by PATRICK ROWLEY Earlier this offseason, a number of writers were talking about how Bryce Harper’s vicious, left-handed swing was “made for Yankee Stadium,” making pinstripes a perfect fit for the young star who grew up a Yankees fan. That thought intrigued us, so we looked a bit deeper to see which ballpark would be…
-
Who has been a better defender at third base: Arenado or Machado?
By
They’re both excellent. But one has an edge that you might not know about.
-
Stat of the Week: Active players on Hall of Fame path
By
Which current players are Cooperstown worthy?
-
Stat of the Week: Hall of Fame Value Standard Part II
By
Last week’s Stat of the Week looked at Bill James’ newest creation, the Hall of Fame Value Standard (HOF-V), and how it analyzes the worthiness of some of the debatable position player candidates on this year’s Hall of Fame ballot. To supplement that, here’s a look at the pitcher candidates of a similar debatable status.…
-
Larry Walker meets the Hall of Fame standard
By
His numbers may be inflated by Coors Field, but he was an impressive player nonetheless.
-
Fred McGriff has statistical support for Cooperstown
By
McGriff’s Hall of Fame case is simple and reasonable. And now he has another chance to be elected by the Contemporary Baseball Era committee.
-
For Edgar Martínez, voters are catching up to HOF worthiness
By
The statistical support is there for Martinez’s candidacy. This may be the year his dream gets realized.